MagTool
Download MagTool V2 (released 22 February 2022) here
MagTool V2 Overview
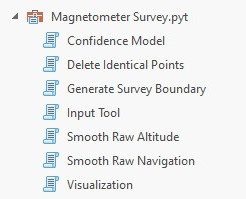
Currently there are seven individual utilities within this Python Toolbox. They are described as follows:
1.Smooth Raw Navigation: Executes a rolling stats (moving average) filter to smooth raw navigation data. The filter iterates through individual survey lines per user input and saves outputs as new fields in the data table (one each for X,Y positions).
2.Smooth Raw Altitude: Executes a rolling stats (moving average) filter to smooth and despike raw altimeter data. The filter iterates through individual survey lines per user input and saves outputs as a new field in the data table. This tool also creates line-wise plots of sensor altitude pre and post smoothing for QA/QC review.
3.Input Tool: Imports raw data file into an ArcGIS file geodatabase via a defined feature class schema. Plots the sample point features (rawPoints) which are used to generate tracklines (surveyLines). Establishes attribute table values for each sample to include total field magnetic value, altitude, date, time, and survey run line name.
4.Delete Identical Points:Filters the rawPoints feature class to remove duplicate points within user-defined spatial tolerance.
5.Generate Survey Boundary: Uses input feature geometry to produce convex hull and dissolved buffer polygons encompassing actual magnetic survey data tracklines or points. Used downstream as an analysis mask.
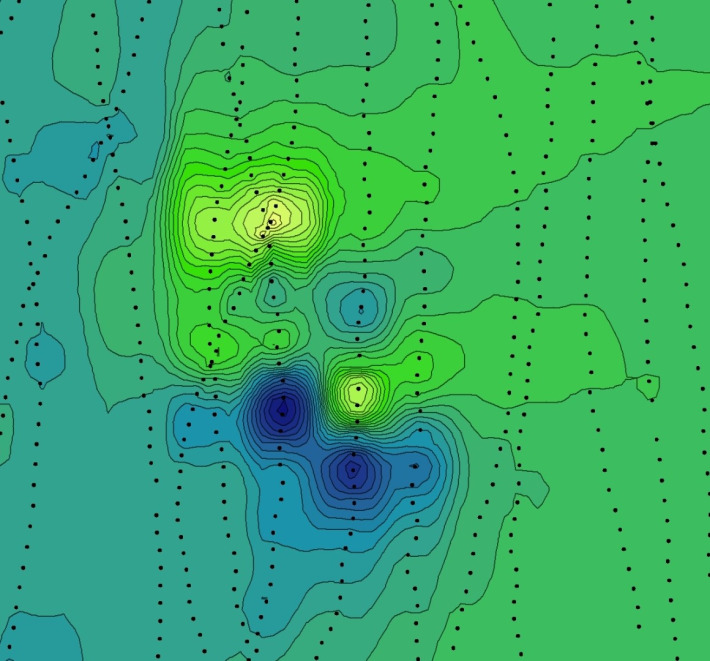
6.Visualization: Runs a spatial gradient computation over the total field channel resulting in a filtered output. Interpolates and contours the total field and spatial gradient channels according to user-selected interpolation method and user-defined contour intervals. Output feature class object names are derivative of input parameters; this script can be run multiple times with altered parameters without overwriting individual outputs. Results from this tool can be used for magnetic anomaly identification.
7.Confidence Model: Performs a series of geospatial analyses to determine theoretical levels of survey coverage based on raw data point geometry, sensor altitude, sensor noise, and user-defined magnetic moment values. Outputs include raster surfaces to visualize and statistically describe coverage levels per input parameters.
Notes on utilization
Refer to XML files provided in the compressed archive via the link above. These contain descriptions and information pertaining to input parameters, usage, and function. Two tools, Smooth Raw Navigation and Smooth Raw Altitude, utilize functions from the pandas Python Data Analysis Library. They are integrated into the Python Toolbox and ArcGIS GUI for ease of utilization but they do not use or generate any GIS files. Standalone copies are available upon request which will function in any Python IDE; they can be extremely useful for cleaning underwater sensor data or navigation channels for an array of data types. Using these scripts outside of ArcGIS will require the user to manually define input parameters and pathways, however. All other tools utilize Arcpy and/or Numpy and are best accessed through the ArcGIS Geoprocessing or Catalog interface. Version tested on ArcGIS Pro 3.0.2; requires Spatial Analyst and 3D Analyst extensions.
